In Windows, certain running processes can generate heavy disk I/O, potentially affecting the performance of other apps. This article explores the basic Windows tools that can help you identify processes that are heavily loading the disk subsystem.
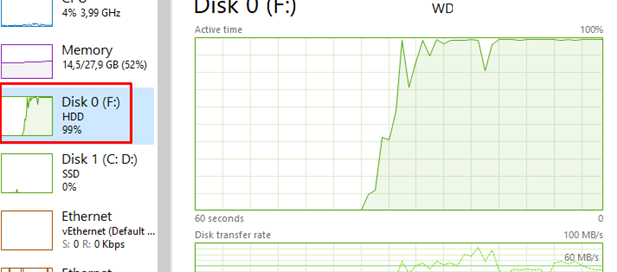
The easiest way to view the current disk load is through the Task Manager. Press Ctrl +Shift + Esc, go to the Performance tab, and select one of the physical disks. The screenshot shows an example of a situation in which one of the disks is loaded at 100%.
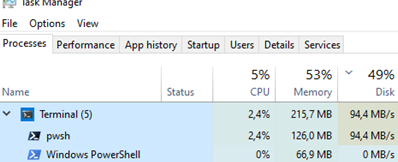
On the Processes tab, you can find out which process is causing high disk usage. The new Task Manager in Windows 10 and 11 includes a Processes tab with a new column for disk load, in addition to the standard columns for RAM and CPU usage. Sort the processes by the Disk column. At the top, you will see the names of the programs consuming the most disk resources.
To get more detailed information, right-click on the process and select Go to Details.
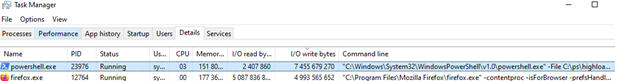
For convenience, let’s add additional columns to Task Manager. Right-click on the header of the process table, select “Select Columns“, and then add the following:
- I/O read bytes
- I/O write bytes
- Command line
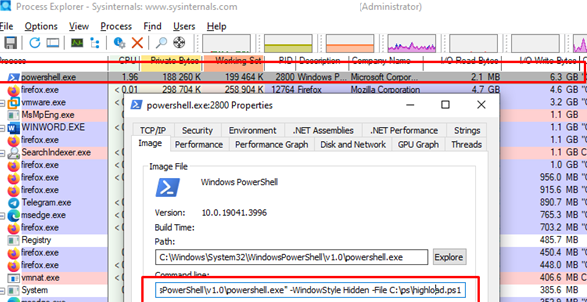
This will help you understand the disk usage profile (whether the process is primarily performing read or write operations) and view the command line used to launch the program. In this case, it is clear that a running PowerShell script causes the high load on the disk (*.PS1).
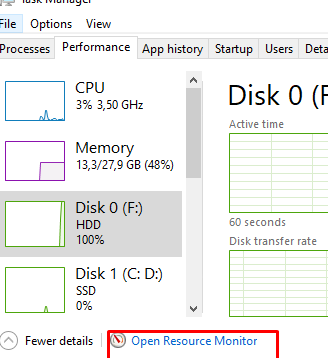
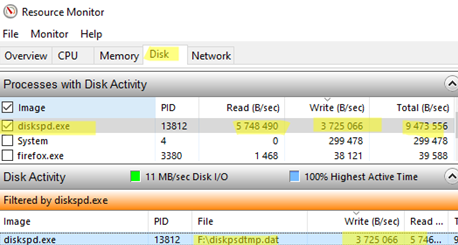
We identified the process causing high disk usage, but it remains unclear which file(s) are being actively written to or read. The built-in Resource Monitor can help identify files in use. You can open it from the Performance tab or by using the resmon.exe command.
Go to the Disk tab. Sort the processes by I/O activity and select the process that is causing the high disk load by enabling the checkbox next to it.
A filtered list of files used by this process will now be displayed in the Disk Activity section. Find the file with the most write and/or read operations. This is the file you are looking for.
Microsoft’s Process Explorer tool can also be used to identify which processes and threads are placing a high load on the disk. Process Explorer provides detailed information about disk load. This allows you to identify the specific processes and threads responsible for intensive disk activity and examine the files and resources they use. This allows you to identify the specific processes and threads responsible for the intensive disk activity, as well as the files and resources that they are using.
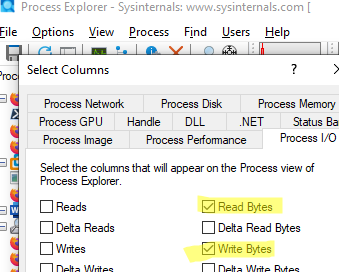
By default, Process Explorer does not display information about read and write operations. To add the I/O Read Bytes and I/O Write Bytes columns, go to the Process IO tab and select View -> Select columns.
Sort the processes by I/O to find those causing high disk load. In the Threads tab, you can also find specific process threads that are causing intensive I/O.
It can be difficult to identify a process that is placing a heavy load on the disk using Task Manager or Resource Monitor if the process is running under SYSTEM privileges. Such processes may not be visible in the Task Manager.
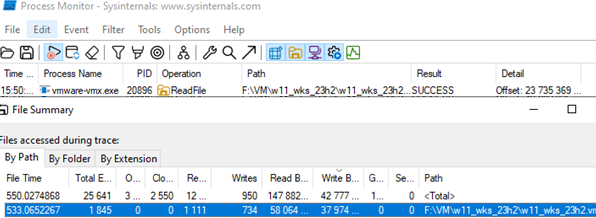
The screenshot below shows an example of the SYSTEM process using the VMDK file. The context makes it clear that this is a VMware Workstation virtual machine file, but this is not obvious from the name of the process.
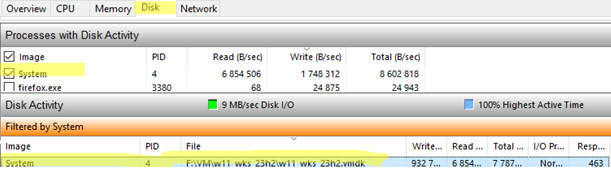
In this example, it is a System process with PID 4. This is a standard kernel-mode system process (device drivers also run in this process). The Process Monitor (ProcMon) utility is better for exploring disk usage by system processes because it shows disk I/O activity, including that of kernel-level processes.
Procmon can display information about file usage activity. Select Tools -> File Summary. Select the highly used file and double-click it. This will add the file path to the Procmon filters. In my case, I find that the high disk load is caused by vmware-vmx.exe process (The primary VMware Workstation process is responsible for running virtual machines).
Information about the disk activity of the processes can also be obtained from the Performance Counters. The following PowerShell command lists the top 10 processes by disk activity in real time, as reported by performance counters:
Get-Counter '\Process(*)\IO Data Bytes/sec' | Select-Object -ExpandProperty CounterSamples | Sort-Object -Property CookedValue -Descending | Select-Object InstanceName, CookedValue -First 10
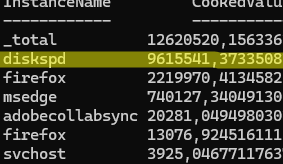
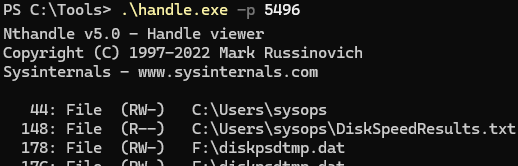
The top 10 processes with high disk I/O activity will be shown. Use the Handle CLI tool from Sysinternals to see which files a specific process is using:
handle.exe -p <ProcessNameOrPID>
This command displays all open file descriptors of the specified process (identified by its PID).
We’ve reviewed the main administrative tools that help identify which processes generate a high disk load.