Graylog is a full-featured, open-source solution for centralized log collection, storage, visualization, filtering, searching, and analyzing. It can also be used in monitoring tasks and to send alerts. Graylog can collect logs and events from hundreds of network devices, including Linux servers, Windows servers, network equipment, or other hardware. Graylog is a powerful platform that can store terabytes of logs while allowing them to be searched almost instantly. The deployment of the Graylog stack and its basic capabilities for logging tasks are covered in this guide.
The following components are part of the Graylog stack:
- Graylog Server – visualization and configuration web interface.
- MongoDB – the database used to store metadata information.
- ElasticSearch or its fork OpenSearch – used for storing and full-text searching structured and unstructured logs.
- Java (OpenJDK) – is OpenSearch’s (ElasticSearch’s) runtime.
To store the logs, we’ll use OpenSearch, which is a free, open-source analog of the ELK stack (Elasticsearch + Logstash + Kibana).
How to Install the Graylog Stack on Linux Systems
The installation instructions for the Graylog stack are very different for each version. We, therefore, recommend that you manually select your Linux distro and Graylog version on the https://go2docs.graylog.org/current/home.htm website. Debian 12 and Graylog 5.2 are used in this guide.
We will use:
- OpenJDK 17
- OpenSearch 2.x (or Elasticsearch 7.10.2 – the only version which is Graylog 5.2 compatible)
- MongoDB 5.x or 6.x (MongoDB 7 is currently not recommended for deployment)
- For a small installation, Graylog Server requires at least 2GB of RAM.
Install the prerequisites and add the MongoDB 6 repo:
$ sudo apt-get install gnupg curl
 $ curl -fsSL https://www.mongodb.org/static/pgp/server-6.0.asc | sudo gpg -o /usr/share/keyrings/mongodb-server-6.0.gpg --dearmor
 $ echo "deb [ signed-by=/usr/share/keyrings/mongodb-server-6.0.gpg] http://repo.mongodb.org/apt/debian bullseye/mongodb-org/6.0 main" | sudo tee /etc/apt/sources.list.d/mongodb-org-6.0.list
 $ sudo apt-get update
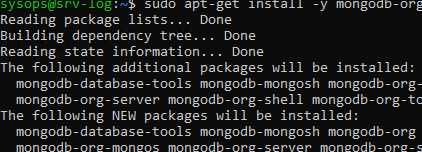
Now install the MongoDB package:
$ sudo apt-get install -y mongodb-org
The following packages have unmet dependencies:
mongodb-org-mongos : Depends: libssl1.1 (>= 1.1.1) but it is not installable
mongodb-org-server : Depends: libssl1.1 (>= 1.1.1) but it is not installable
I had to install an additoonal libssl package:
Fix it by installing the libssl package.
$ sudo wget http://archive.ubuntu.com/ubuntu/pool/main/o/openssl/libssl1.1_1.1.1f-1ubuntu2_amd64.deb
 $ sudo dpkg -i libssl1.1_1.1.1f-1ubuntu2_amd64.deb
Start the service:
$ sudo systemctl daemon-reload
 $ sudo systemctl enable mongod.service
 $ sudo systemctl restart mongod.service
 $ sudo systemctl --type=service --state=active | grep mongod
Then proceed with the OpenSearch installation.
$ sudo apt-get update && sudo apt-get -y install lsb-release ca-certificates curl gnupg2
Add the repo:
$ curl -o- https://artifacts.opensearch.org/publickeys/opensearch.pgp | sudo gpg --dearmor --batch --yes -o /usr/share/keyrings/opensearch-keyring
 $ echo "deb [signed-by=/usr/share/keyrings/opensearch-keyring] https://artifacts.opensearch.org/releases/bundle/opensearch/2.x/apt stable main" | sudo tee /etc/apt/sources.list.d/opensearch-2.x.list
 $ sudo apt update
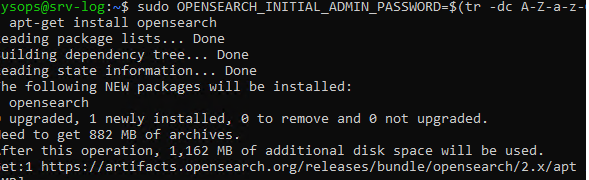
Starting from OpenSearch 2.12, you must set an administrator password during installation:
$ sudo OPENSEARCH_INITIAL_ADMIN_PASSWORD=$(tr -dc A-Z-a-z-0-9_@#%^-_=+ < /dev/urandom | head -c${1:-32}) apt-get install opensearch
Next, configure the OpenSearch settings:
$ sudo nano /etc/opensearch/opensearch.yml
It is sufficient to configure the following parameters for a simple single-node configuration:
cluster.name: graylog
node.name: ${HOSTNAME}
path.data: /var/lib/opensearch
path.logs: /var/log/opensearch
discovery.type: single-node
network.host: 0.0.0.0
action.auto_create_index: false
plugins.security.disabled: true
indices.query.bool.max_clause_count: 32768
Configure the settings for the SMTP server to be used for sending email notifications:
transport_email_enabled = true
transport_email_hostname = smtp.gmail.com
transport_email_port = 465
transport_email_use_auth = true
transport_email_use_tls = false
transport_email_use_ssl = true
transport_email_auth_username =
transport_email_auth_password =
transport_email_subject_prefix = [graylog]
transport_email_from_email =
transport_email_web_interface_url =
Then change the default Java settings:
$ sudo nano /etc/opensearch/jvm.options
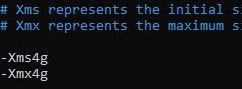
Use the Xms and Xmx parameters to specify how much memory the Java Virtual Machine can use. It is recommended that half of the host’s RAM is set here. For example, if your host has 8GB of RAM, allocate 4GB here:
-Xms4g
-Xmx4g
Change virtual memory settings:
$ sudo sysctl -w vm.max_map_count=262144
 $ sudo echo 'vm.max_map_count=262144' >> /etc/sysctl.conf
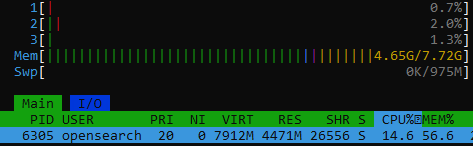
Start the OpenSearch service:
$ sudo systemctl enable --now opensearch
Then proceed to install the Graylog Server. There are two versions of Graylog. The free Graylog Open and the subscription-based enterprise Graylog Operations.
To install Graylog Open:
$ wget https://packages.graylog2.org/repo/packages/graylog-5.2-repository_latest.deb
 $ sudo dpkg -i graylog-5.2-repository_latest.deb
 $ sudo apt-get update && sudo apt-get install graylog-server
Create passwords for two variables, password_secret and root_password_sha2. Graylog will not start without them.
The password password_secret must be at least 64 characters long:
$ pwgen -N 1 -s 96
Next, get the Graylog administrator password hash. The following command generates a hash of the password you entered:
$ echo -n "Enter Password: " && head -1 </dev/stdin | tr -d '\n' | sha256sum | cut -d" " -f1
Add the resulting password_secret and root_password_sha2 values to /etc/graylog/server/server.conf
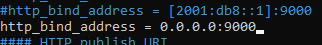
Set the Graylog web server IP address and port in http_bind_address.
Start Graylog:
$ sudo systemctl enable --now graylog-server
Getting Started with Graylog Configuration
Now log in to the Graylog web interface using the admin user and password whose hash you specified in the configuration file. However, this password will not be accepted the first time you log in.
If you look at the GrayLog server logs, you will find an interesting message:
$ cat /var/log/graylog-server/server.log
It seems you are starting Graylog for the first time. To set up a fresh install, a setup interface has been started. You must log in to it to perform the initial configuration and continue.
Initial configuration is accessible at 0.0.0.0:9000, with username 'admin' and password 'eDLaYAlaeX'.
Try clicking on http://admin:eDLaYAlaeX@0.0.0.0:9000
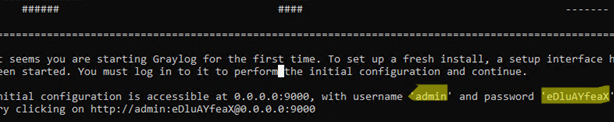
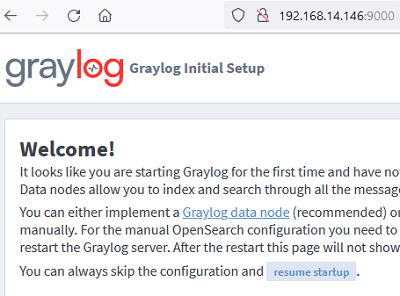
Use the temp password from the log file to sign in for the first time. Use the simple initial configuration wizard. Graylog data node mode is used to configure a multi-node OpenSearch cluster. This step can be skipped for simple configuration with a single log host.
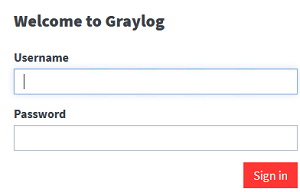
Then log in to the Graylog web interface using the admin user and password:
Once logged in, create your Graylog user under System-> Users and Teams. Some settings of the built-in Admin account cannot be customized, so it is better to create a separate user account. Assign the Admin role to this user and specify an email address.
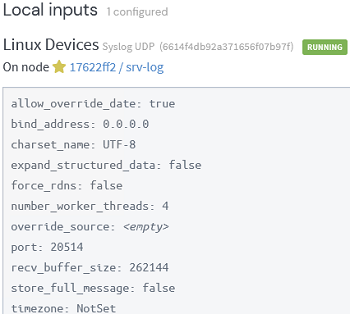
Now we need to create the Inputs (data collectors). It is preferable to create a separate input for each device class (Linux servers, computer networking devices, Windows hosts, etc).
We will create a Syslog UDP input for Linux hosts. Specify its name and the port on which the Graylog server will receive data. Leave the other settings as default.
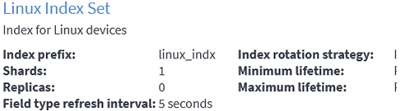
Now go to System -> Indices and create a separate index for the Linux device class.
Specify a name, description, and prefix (for example, linux_indx ). Configure how many days to keep old logs, when to delete old indexes, and the maximum index size.
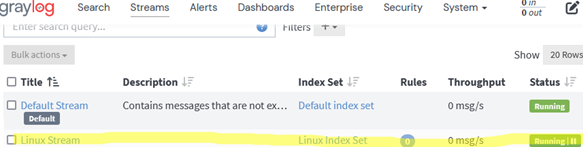
Create a separate Stream for each input. This allows logs from different device classes to be split between different indexes. Go to Stream -> Create Stream -> specify the name of the stream and select the index you want to use.
In the Stream settings, add a new rule specifying the type of logs assigned to this stream. In the example, select Match Input -> select your Linux Input.
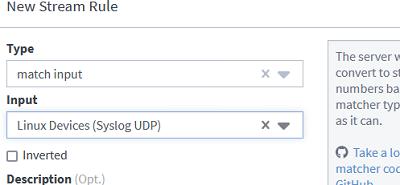
Then start the stream.
How to Send Logs from Linux into Graylog
Now configure your client devices to send events and logs to Graylog. Graylog can receive data from various sources: Filebeat, Winlogbeat, Nxlog, Syslog, Rsyslog, etc.
To collect logs and send them to Graylog, you can use rsyslog on Linux servers
$ sudo apt install rsyslog
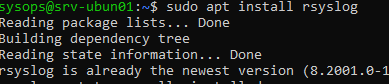
$ sudo systemctl status rsyslog
Once the rsyslog service is running, configure which logs to send to Graylog.
$ sudo nano /etc/rsyslog.d/60-graylog.conf
Add the following line to the file:
*.*@192.168.14.146:20514;RSYSLOG_SyslogProtocol23Format
In this example, we will send all logs in syslog format to the Graylog server (192.168.14.146) on the port you set for input (20514).
Restart the rsyslog:
$ sudo systemctl restart rsyslog
Searching and Analyzing Logs in Graylog
Now go to the Search Graylog tab, select the ‘Linux’ stream and you will see all the events that have been received from your hosts in the last 5 minutes (the time range can be changed).
Use simple filters to find specific events. The Graylog search bar is interactive. In the search bar, you select different event properties and choose from the suggested options.
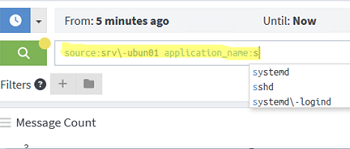
For example, to find all events related to failed SSH connection attempts to a host, use the following search filter:
source:srv\-ubun01 AND application_name:sshd AND message:Fail*
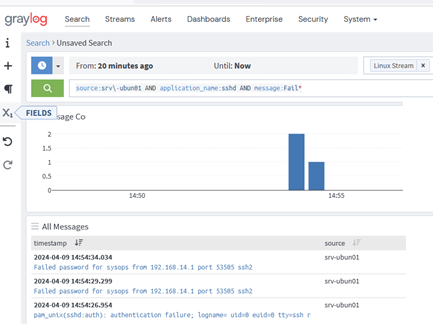
This query returns all logs that meet all three conditions (the AND parameter). If the AND is not specified, Graylog assumes that you are searching for events in OR mode.
The table will show events that match your search criteria. You can expand and explore log details. The search filters in Graylog are quite simple and intuitive to use and explore. You can always expand any event, view the available fields (event attributes), and use their values to filter and search for specific events.
Graylog allows to create and customize different dashboards that display information about events that interest you (can include event counts, hosts, group items, graphs, or maps). Widgets are used to customize dashboards. 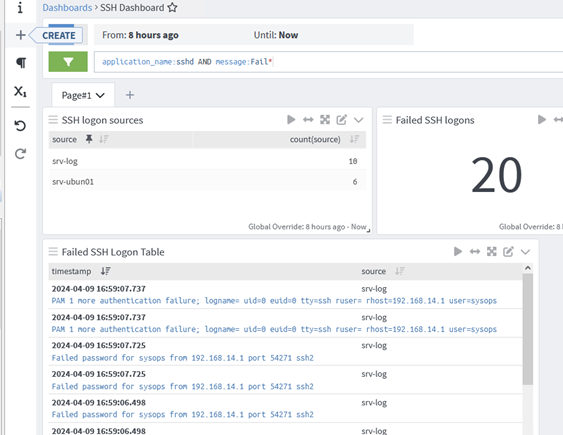
Configure Graylog Alerts on Event Occurrence
When certain events occur, Graylog can send automatic notifications (alerts). For example, I want Graylog to send me an email when someone logs into one of my servers via SSH.
Go to Alerts -> Alerts and Events. In the Notification tab, add email addresses to send email to.
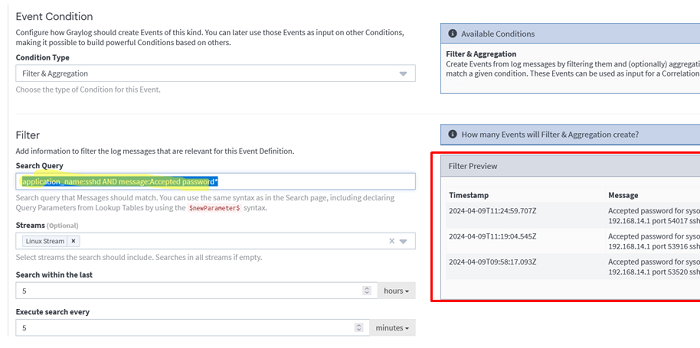
Create a query to search for events you want to be notified about in the Event Definition. To track SSH logins to Linux hosts, select the appropriate stream and specify a search query:
application_name:sshd AND message:Accepted password*
A list of events matching your criteria will appear in the right preview pane. Check that all the events you are looking for have been found. If not, edit your search query.
All that remains is to select the type of notification -> email. When a certain event occurs in the logs, Graylog will send an email notification.
In this article, we have covered the basics of deploying and using Graylog for centralized log collection and analysis. In the next article, we’ll look at how to use Graylog to centrally collect and search logs from Windows servers.