Domain users often complain about long computer startup and logon times caused by slow processing of assigned Group Policies (GPOs). From the user’s point of view, the computer takes a long time to boot and seems to hang for several minutes at the “Applying computer/user settings” stage. In this article, we’ll look at how to find out how long it takes for GPO settings to apply on a computer, identify policies that make applying computer settings slow, and speed up Group Policy processing.
Enable Detailed Windows Startup/Logon Messages
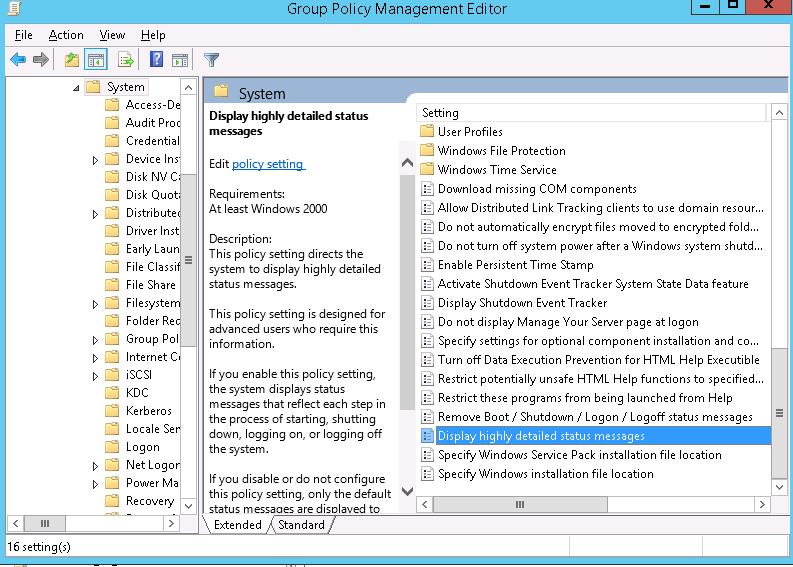
Windows can display verbose messages on the startup screen that reflect each background step that is performed during the boot and logon process. This detailed status information allows users and administrators to visually understand at what stage of the computer boot the greatest delay is occurring. This mode can be enabled via the GPO option Display highly detailed status messages under Computer Configuration -> Policies -> System.
REG Add "HKLM\SOFTWARE\Microsoft\Windows\CurrentVersion\Policies\System\" /V "verbosestatus" /T REG_DWORD /D 1 /F
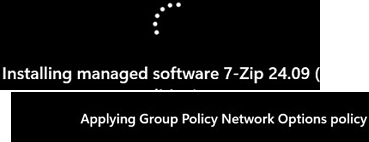
Now, when Windows starts up, information about the GPO components being applied will be displayed on the screen. For example:
Applying Group Policy Network Options policy
Applying Group Policy Local Users and Groups policy
The screenshot below shows that one of the assigned GPOs installs an MSI package on the user’s computer. Installing software can actually take a long time while your computer is booting.
Find the Group Policy Processing Time in Event Viewer
To find out how long it took to apply (process) GPO settings on a computer, open the Event Viewer snap-in.
In the eventvwr.msc console, go to Applications and Services Logs –> Microsoft –> Windows –> Group Policy –> Operational. Filter the log by the following event IDs:
- 8000 – appears when computer policy processing is complete
- 8001 – user logon policy processing completed
The time taken to process this GPO section is included in the description of such events:
Completed computer boot policy processing for WOSHUB\PCWKS3$ in 43 seconds.
Event IDs 4016 and 5016 contain information about the start and end times of GPO client extension processing (CSE, Client-Side Extensions). Typically, these are events that detail the processing of individual components of Group Policy Preferences(GPP). For example, mapping network drive policies, creating scheduler tasks, adding users to local groups, etc. The description of such events includes the name of the CSE and the time required for the policy settings in this section to apply:
Completed Group Policy Registry  Extension Processing in 109656 milliseconds.
Completed Software Installation Extension Processing in 39016 milliseconds.
Check GPP Processing Time in the GPResult Report
Generate a GPResult HTML report containing detailed information about the resulting Group Policy settings on the computer:
gpresult /h c:\scripts\gpreport.html
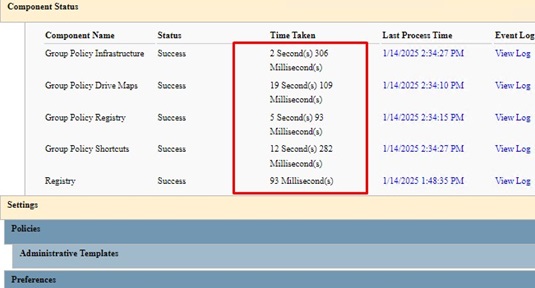
In addition to information about the GPO settings that have been applied, the Component Status section (available in both the Computer and User sections of the GPO report) shows how long it took to apply the various components of the Group Policy Preferences (in ms).
For each component of the GPP client-side extension used (including policies for configuring the registry, creating shortcuts, etc.), the total processing time is given.
In my case, the Group Policy Drive Maps policy took 19 seconds to apply (which is quite a long time). To find out possible reasons for slow policy processing, click the View Log button.
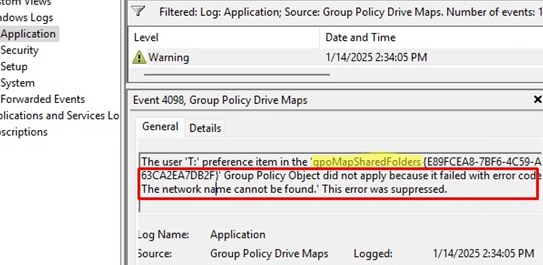
Also, open the Event Viewer -> Applications and filter the events by the Group Policy Drive Maps source.
In this example, the reason for the long policy processing is that an unavailable path is specified in one of the mapped network drive settings. If there are several such drives, the timeout for each of them will be about 20 seconds, significantly increasing the total boot time of the computer. Check if the network path is correct, and edit the specified GPO by removing the network drive mapping or changing the UNC path.
Block Group Policy Inheritance
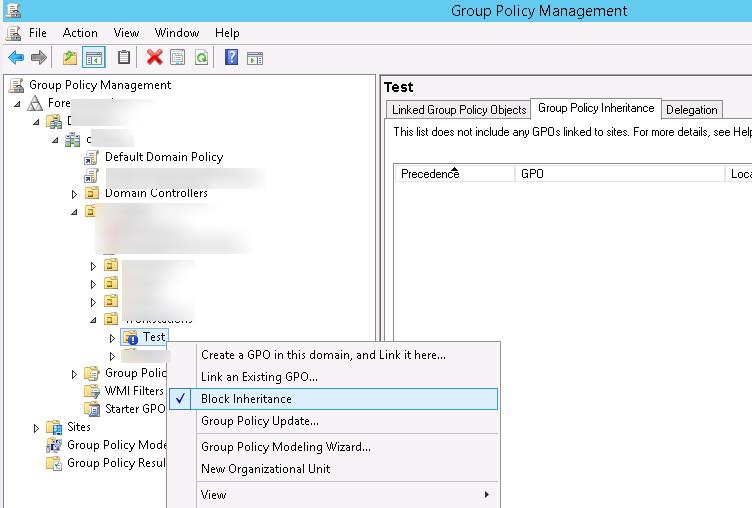
To be sure that the problem is related to domain GPOs, create a separate OU in the domain and move the problem computer to it. Then, using the Group Policy Management console (GPMC.msc), enable the Block Inheritance option for this container. This will stop all domain policies from applying to the computer (except those policies that are in Enforced mode).
Restart the computer and check if the problem with the slow GPO applying persists. If it persists, the problem is likely with the computer itself or with local group policies (try resetting local GPO settings).
Enable Group Policy Service (GPSVC) Debug Log
For a detailed GPO log, you can enable the Group Policy Client Service (GPSVC) debug log. This requires creating a usermode folder and a GPSvcDebugLevel registry parameter:
md %windir%\debug\usermode
 REG ADD "HKLM\SOFTWARE\Microsoft\Windows NT\CurrentVersion\Diagnostics" /v GPSvcDebugLevel /t REG_DWORD /d 0x00030002 /f
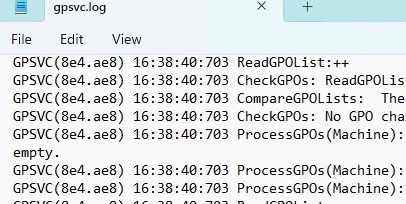
After the restart, the Group Policy Client service logs all policy processing events to the gpsvc.log file ( %WINDIR%\debug\UserMode\gpsvc.log).
Open the log file, find the events that caused the long delays, and analyze whether they might be related to the long boot time when applying policies. Timestamps in gpsvc.log can be used to find GPO components that take a long time to process.
Enable Group Policy Preferences Debug Logging
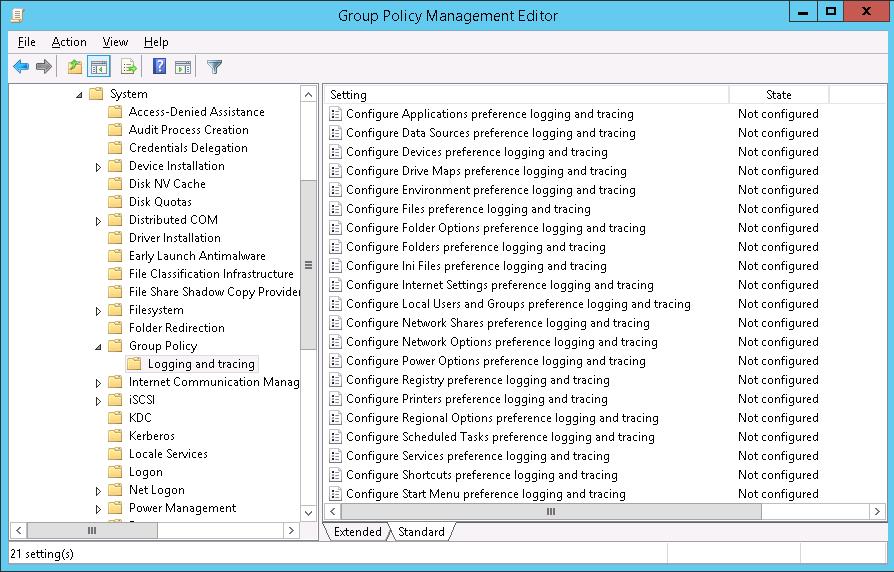
Group Policy Preferences extensions can also log the loading of each CSE (Client-Side Extensions) component. CSE debug logs can be enabled under the following GPO section: Computer Configuration -> Policies -> Administrative Templates->System->Group Policy -> Logging and tracing
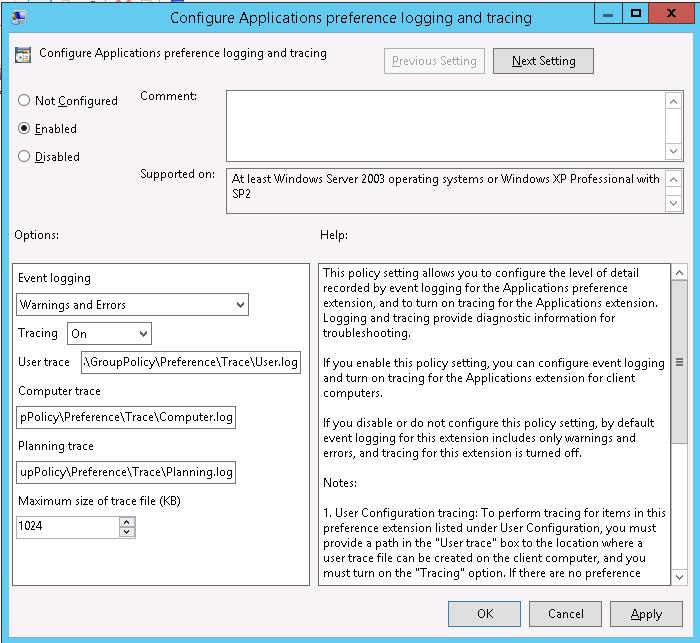
Individual settings are available for each CSE. In the policy settings, you can specify the type of event logged (Informational, Errors, Warnings, or all of them), the maximum log size, and the log location path. The default paths are
- User policy trace file
%SYSTEMDRIVE%\ProgramData\GroupPolicy\Preference\Trace\User.log - Computer policy trace file
%SYSTEMDRIVE%\ProgramData\GroupPolicy\Preference\Trace\Computer.log
After collecting the logs, review and analyze them for errors, and also try to find nearby events, the time between which is different for a few minutes.
Group Policy Slow Link Detection
On the domain computer, Slow Link Detection mode is enabled by default. The idea is that if the client detects that the connection bandwidth to the domain controller is insufficient (the client is connected over a slow WAN channel or via a VPN), it will not apply some GPO extensions.
By default, a channel is considered slow if its bandwidth is less than 500 kbps.
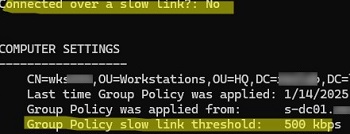
In the gpresult /r report, you can see what type of AD link (fast or slow) the client has detected and the current link threshold.
Connected over a slow link?: No
Group Policy slow link threshold:   500 kbps
Or check the description in the EventID 5314:
A fast link was detected. The Estimated bandwidth is 1000000 kbps. The slow link threshold is 500 kbps.
GPP items (including CSEs, program installations, running scripts, etc.) that require high bandwidth will not be applied if the computer detects that it is connected to a DC over a slow link.
The threshold can be increased using the GPO option Configure Group Policy slow link detection (Computer Configuration -> Administrative Templates -> System -> Group Policy). Some clients on slow connections will start to apply Group Policy settings, which can take a long time if the administrator has increased this limit (or disabled it by setting it to 0).
So, in this article, we have considered the main methods of diagnosing problems with slow Group Policy processing on domain computers. In fact, many other reasons can cause GPO processing to be slow:
- Incorrect AD site configuration
- Complex WMI and LDAP queries in GPO filters or scripts
- Slow (non-optimized) startup/logon scripts in GPO (By default, login scripts run asynchronously)
- Large MSI installer packages in GPO, etc.




5 comments
[…] On peut également utiliser les propositions ici : https://woshub.com/troubleshoot-slow-gpo-processing-and-login-speed-impact/ […]
Great One!! many thanks
so good , thancks
Great post, this helped me so much, to pin down which printer policy was causing a 10 minute boot time delay.
The cause of the long first login can be configured in Active Setup policies. These settings, which apply to each user only once, are set when the profile is created.
Check the Active Setup settings in reg key HKLM\Software\Microsoft\Active Setup\Installed Components