The basic metrics for evaluating storage performance are data transfer rate (throughput, how much data can be read or written per unit of time) and IOPS (Input/Output Operations Per Second). In simple terms, IOPS is the number of read and write operations that a storage, disk, or file system can perform per second. Throughput is important when working with large files, while IOPS is more important in workloads with many small files and random access (databases or virtual machines). Another important storage metric is latency, which is the time required for a disk to complete a request, since it directly affects system responsiveness.
In this article, we will look at several ways to measure the storage performance (IOPS, latency, throughput) in Windows (you can use this manual to test the performance of a local hard drive, SSD, SMB network folder, CSV volume, or LUN on SAN/iSCSI storage).
Check Storage I/O Performance Using PerfMon in Windows
The Task Manager is a simple tool that allows you to quickly assess disk performance in real time. Press Ctrl+Shift+Esc, then go to the Performance tab and select the physical disk.
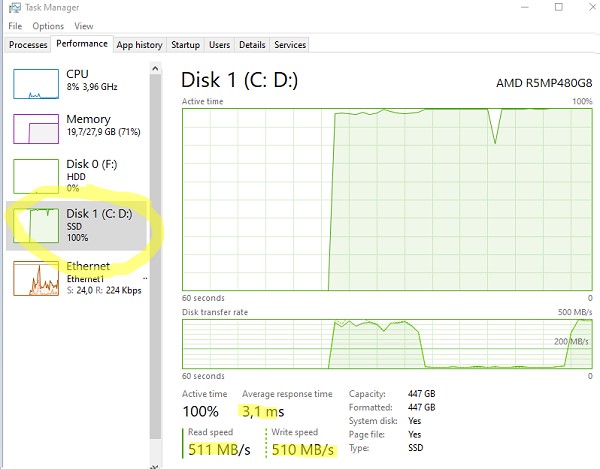
Here you can see the current Write and Read speeds, as well as the Average response time (latency).
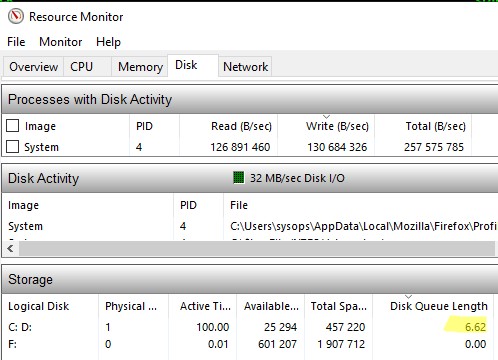
To check the current disk queue length, open the Resource Monitor (resmon). The current Disk Queue Length value is displayed in the Storage section of the Disk tab.
You can estimate the current storage I/O load in Windows by using the built-in disk performance counters from Performance Monitor. To collect these counter data:
- Run
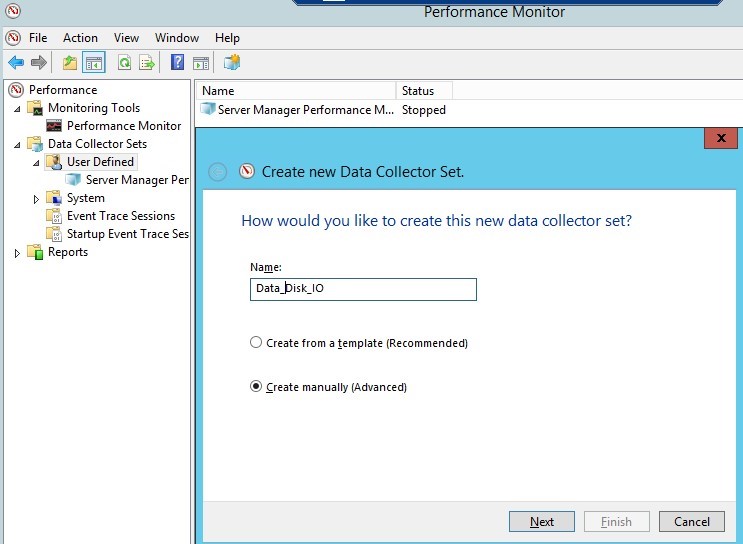
Perfmon - Create a new Data Collector Set and select Create manually.

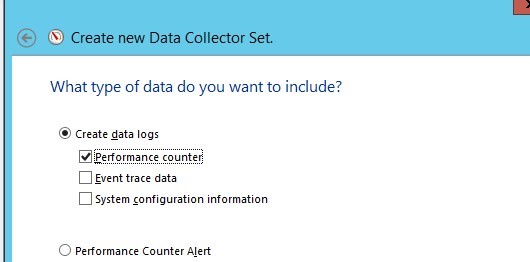
- Check the box Create data logs -> Performance counter.

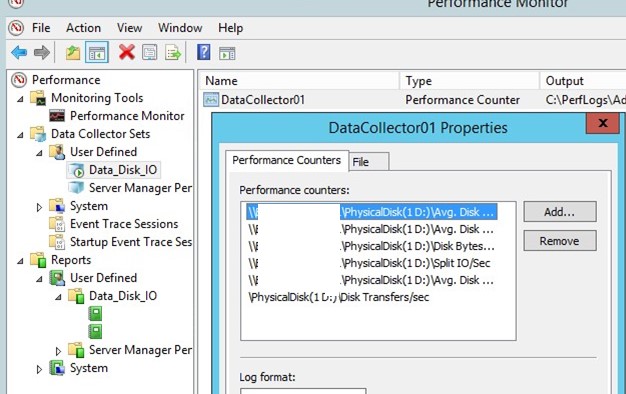
- Now, in the properties of the new data collection set, add the following performance counters for the Physical Disk object (you can select counters for a specific disk, or for all the local disks connected):
Avg. Disk Sec./Transfer(latency)Avg. Disk Queue LengthAvg Disk Bytes/TransferDisk Bytes/sec(disk speed/throughput)Disk Transfers/sec(IOPS)Split IO/sec
- You can also change the other data collection properties. Counter values are collected by default every 15 seconds.To display real-time disk performance graphs, add the specified Perfmon counters in the Monitoring Tools -> Performance Monitor section.

- The next step is to start collecting performance counter data by selecting Start and waiting for sufficient information to be collected for analysis. After that, right-click your data collector set and select Stop.

- To view the collected performance data, go to the Perfmon -> Reports -> User Defined -> Data_Disk_IO -> select_your_set. By default, disk performance data is displayed in the form of graphs.
- Press
Ctrl + Gto switch to the Report mode.

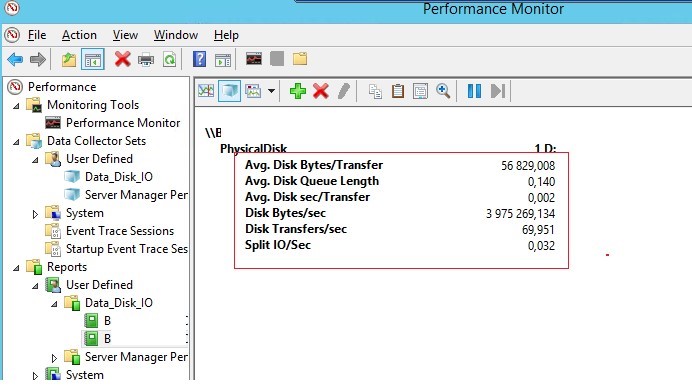
How can you interpret the storage performance results collected by Perfmon? To quickly analyse disk/storage performance, you need to look at the values of at least the following five counters.
- Disk sec/Transfer – the time taken to perform a single write/read operation with the storage device or disk (disk latency). If the delay is more than 25 ms (0.25), then the disk array cannot handle the I/O operation on time. For high-load systems, the disk latency value should not exceed 10 milliseconds (0.1).
- Disk Transfers/sec – (IOPS) The number of read/write operations per second. This is the main indicator of the disk access intensity (the reference IOPS values for the various disk types can be found at the end of the article).
- Disk Bytes/Sec – disk throughput (read+write) per second. The maximum values depend on the disk type (150-250 MB/s for a regular HDD disk and 500-10000 MB/s for an SSD).
- Split IO/sec –the disk fragmentation indicator shows when the operating system has to split a single I/O operation into multiple disk requests. This may also indicate that the application is requesting data in blocks that are too large to be transferred in one operation.
- Avg. Disk Queue Length – disk queue length (the average number of transactions that were queued and waiting to be processed). For a single disk, the queue length should not exceed 2. For a RAID array of 4 disks, the threshold value of disk queue length is 8.
Quick Disk Speed Test with WinSat Command
If you want to quickly evaluate the performance of your HDD or SSD drive in Windows, you can use the built-in winsat (Windows System Assessment Tool) console command. This tool was previously used to obtain the Windows Experience Index (WEI) score.
To run the speed test against the C: drive, open a command prompt, and run:
winsat disk -drive C
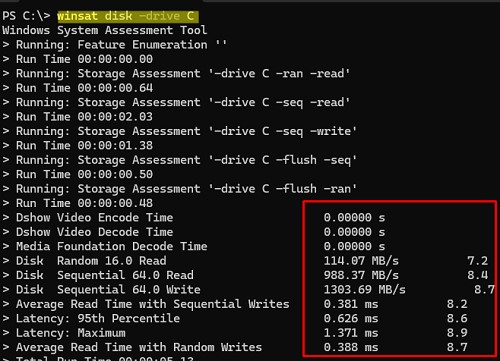
This command runs a set of sequential and random read/write tests and reports the read and write throughput in MB/s, along with average and maximum latency. For each value, an overall rating is returned on a 10-point scale (this is the Windows performance index shown in earlier versions of Windows).
> Disk  Random 16.0 Read                       114.07 MB/s          7.2
> Disk  Sequential 64.0 Read                   988.37 MB/s          8.4
> Disk  Sequential 64.0 Write                  1303.69 MB/s          8.7
> Average Read Time with Sequential Writes     0.381 ms          8.2
> Latency: 95th Percentile                     0.626 ms          8.6
> Latency: Maximum                             1.371 ms          8.9
> Average Read Time with Random Writes         0.388 ms          8.7
Disk assessment tests can be run for certain I/O workloads:
- sequential read assess:
winsat disk -seq -read -drive F - sequential write assess:
winsat disk -seq -write -drive F - random read:
winsat disk -ran -read -drive F - random write:
winsat disk -ran -write -drive F
DiskSpd: Testing Storage Performance and IOPS in Windows
Microsoft recommends using the DiskSpd tool (https://aka.ms/diskspd) to generate a load on a disk (storage) device and measure its performance. This console command can be used to perform I/O load testing of your storage subsystem with a specified target, using multiple threads. I often use this tool to load the storage system and measure its real-world performance in terms of IOPS, throughput, maximum read and write speeds, and latency.
The DiskSpd does not require installation; just download and extract the archive. For x64-bit systems, use the version of diskspd.exe from the amd64fre directory.
The following command template can be used to run your storage performance benchmarking:
diskspd.exe –c50G -d300 -r -w40 -t8 -o32 -b64K -Sh -L E:\diskpsdtmp.dat > DiskSpeedResults.txt
diskspd.exe is running. To avoid performance degradation for users, it is not recommended to start tests on productive systems during peak or working hours.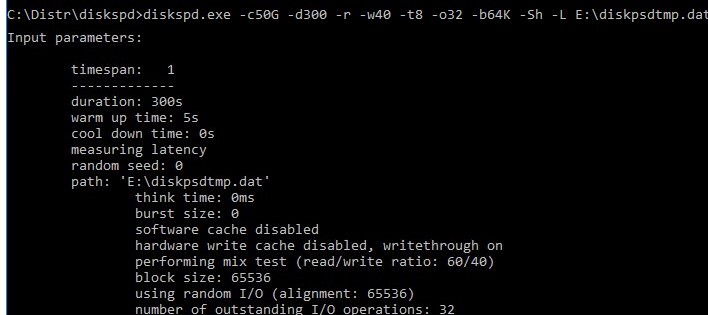
-c50G– file size 50 GB (a large file size is preferable so that it does not fit into the storage controller cache)-d300– test duration in seconds-r– test by random read/write operations (if you need to test sequential access, use–s)-t8– number of threads-w40– ratio of write to read operations 40%/60%-o32— queue length-b64K— block size-Sh— do not use cache-L— measure latencyE:\diskpsdtmp.dat– test file path.
The resulting tables show the average performance values after the stress test has been completed. The following performance data was obtained in my test for an HDD storage array (see the values in the Total IO table):
- MiB/s —
241(not bad) - IOPS —
3866(perfectly well!) - Average latency —
66.206ms (quite a big latency!)
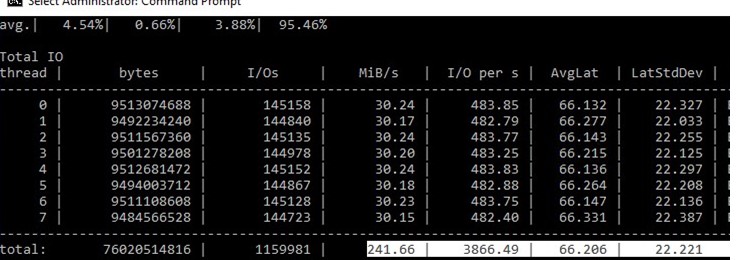
You can get individual values for read (section Read IO) or write (section Write IO) operations.
After testing several disks or storage LUNs with DiskSpd, you can compare the results and choose the storage array that provides the performance necessary for your workloads.
How to Measure Storage IOPS, Throughput, and Latency Using PowerShell
To measure storage performance, you can use a PowerShell script by Mikael Nystrom, Microsoft MVP, which acts as a wrapper around SQLIO.exe, a file storage performance testing tool.
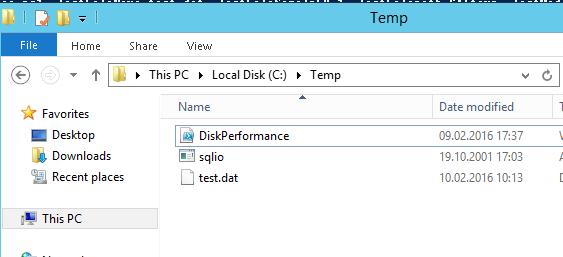
sqlio.exe yourself or download it from our website (it is located in the archive with the PowerShell script).Download the archive containing two files: SQLIO.exe and DiskPerformance.ps1 (disk_perf_iops.ZIP, 74 KB) and extract it to any folder.
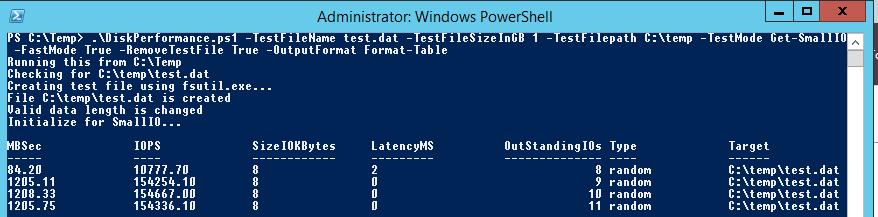
Here’s an example of a PowerShell script that can be used to estimate disk performance and IOPS using SQLIO.exe:
.\DiskPerformance.ps1 -TestFileName test.dat –TestFileSizeInGB 1 -TestFilepath C:\temp -TestMode Get-LargeIO -FastMode True -RemoveTestFile True -OutputFormat Out-GridView
Let’s consider the script arguments:
–TestFileName test.dat– the file name created by the FSUTIL tool.–TestFileSizeInGB 1– the test file size. Possible values are 1.5, 10, 50, 100, 500, 1,000 GB. The file size must be larger than the storage system cache size. Otherwise, IOPS will be measured for cached data rather than real disk performance.-TestFilepath C:\Temp– specify the driver for measuring performance and the folder on the disk in which the test file will be created. It is possible to specify an UNC path to the shared network folder (SMB).-TestMode Get-LargeIO– there are two options for input-output measurement. Get-SmallIO allows to measure IOPS, and Get-LargeIO measures data transfer rate. The difference between the SmallIO and LargeIO arguments is in the block sizes of 8 KB and 512 KB while measuring the rate, and the type of access, Random or Sequential, correspondingly.-FastMode True– in the Fastmode, each test runs for 10 seconds, otherwise it takes 60 seconds.-RemoveTestFile True– remove the test file after the test is over.-OutputFormat Out-GridView– the test results can be displayed either in the PowerShell console (Format-Table) or in a separate graphic chart window (with Out-Gridview cmdlet).
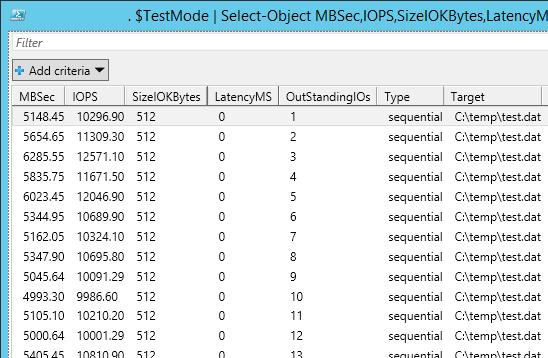
I ran a storage performance test on a virtual machine stored on a VMDK virtual disk on a VMFS datastore connected from an HP MSA 2040 over a SAN. My storage returned an average IOPS value of around 15,000 and a data transmission rate (throughput) of about 5 GB/s.
The approximate IOPS values for different disk types are shown in the following table:
| Type | IOPS |
| SSD(SLC) | 6000 |
| SSD(MLC) | 1000 |
| 15K RPM | 175-200 |
| 10K RPM | 125-150 |
| 7.2K RPM | 50-75 |
| Raid5 of 6 drives with 10K RPM | 1000 |
I have found some recommendations for disk performance in IOPS for some popular Microsoft services:
- A Microsoft Exchange server with 5,000 users, each of them receives 75 and sends 30 emails per day, will require at least 3,750 IOPS.
- Microsoft SQL Server with 3,500 SQL transactions per second (TPS) requires 28,000 IOPS.
- A common Windows application server for 10-100 users requires 10-40 IOPS.
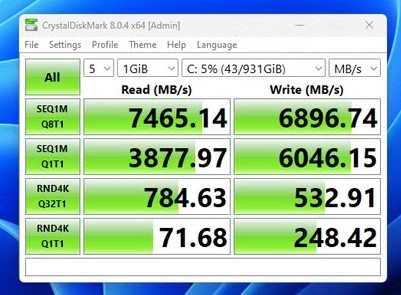
In addition to the built-in Windows utilities, one of the best-known third-party tools for testing drive performance is CrystalDiskMark. This is a simple graphical tool for benchmarking storage with sequential and random read/write speeds (MB/s).
7 comments
If the first column shows Megabits per second, it should be MbSec instead of MBSec. Now it’s Megabytes per second.
Hi, how much Disks are attacht to the MSA2040? And what kind of Disks? SSDs,15k or 10k … 🙂
thanks for your post how can i export to csv or html this data
Hi, does the diskpsdtmp.dat needs to be created? I have tried the command, but there is nothing about this file
where to get it? does the exe created it? In my case, there are errors telling that the file don’t exist , and I created one, but it also says that the size is too small
The diskpsdtmp.dat file is created automatically by the diskspd tool. Verify that the specified directory path exists and that there is sufficient free space on the disk.
Version with diskspd.exe
https://social.technet.microsoft.com/wiki/contents/articles/32776.powershell-test-diskspdblock-script-for-storage-performance-testing.aspx
[…] Windows OS Hub […]