In this article, we will explore the specifics of monitoring Windows hosts with Zabbix, from installing the agent and connecting the Windows node to the Zabbix server to collecting metrics and configuring alerts.
Installing Zabbix Agent on a Windows Machine
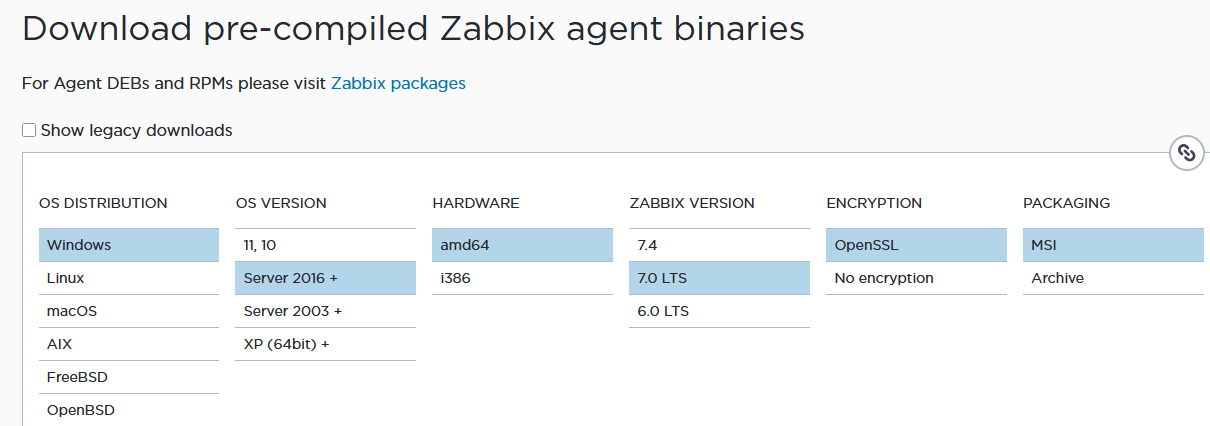
I have a Windows Server 2022 host that I want to monitor using Zabbix. The Zabbix agent must be installed and configured on the host in order to achieve this. Download the pre-compiled MSI installer for the Zabbix agent from the official website (https://www.zabbix.com/download_agents). Select the Zabbix agent version that corresponds to your Windows version. Both an MSI installer and binary files for manual agent deployment are available.
Note that there are two versions of the Zabbix Agent available: version 1 and version 2. Zabbix Agent 2 is the preferred option for the latest versions of the Windows OS (provided your Zabbix server version supports it).
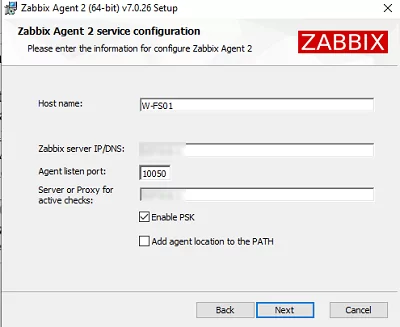
During installation of the Zabbix agent MSI package, you will be prompted to enter your computer’s host name and the DNS name (IP address) of the target Zabbix server.
In my case, the Windows host running the Zabbix agent (client) is located behind a NAT, meaning it cannot be accessed directly from the Zabbix server. Therefore, we cannot use the default passive agent mode (where the Zabbix server connects to the client on TCP port 10050). I will use the Active agent mode. To do this, I set the address of my Zabbix server (or proxy, if used) into the Server for active checks field.
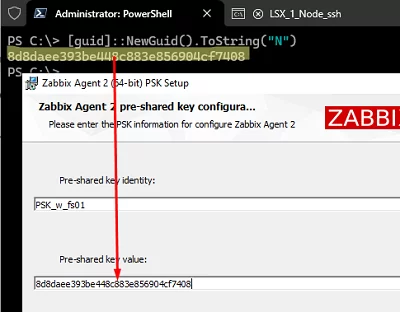
I will use PSK (Pre-Shared Key) to encrypt traffic between the Zabbix server and the client using TLS. First, set the PSK identifier of the key (used to identify the key). Then, generate a random PSK value using PowerShell and paste it into the agent installer field:
[guid]::NewGuid().ToString("N")
After installation, check that the Zabbix Agent 2 service appears in the list of services.

By default, the Zabbix agent settings in Windows are stored in the file C:\Program Files\Zabbix Agent 2\zabbix_agent2.conf Any changes to the Zabbix agent configuration are made through this text file. In my example, only a few options are configured:
LogFile=C:\Program Files\Zabbix Agent 2\zabbix_agent2.log – agent log
Server=123.123.12.12 – Zabbix server address for passive checks (requests from any other Zabbix servers will be rejected)
ServerActive=123.123.12.12 — the Zabbix server (or Zabbix proxy) address for active checks
Hostname=W-FS01 – this is the hostname that will be used to identify it on the Zabbix server
TLSConnect=psk – TLS traffic encryption requirement is enabled
TLSAccept=psk
TLSPSKIdentity=PSK_w_fs01 – PSK identifier
TLSPSKFile=C:\Program Files\Zabbix Agent 2\psk.key – a text file that contains the PSK key you created previously. 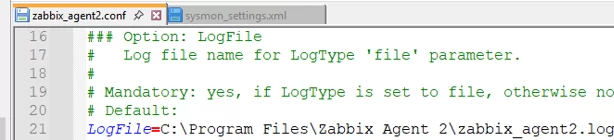
Restart the service after making any changes to the Zabbix agent configuration file:
Restart-Service "Zabbix Agent 2"
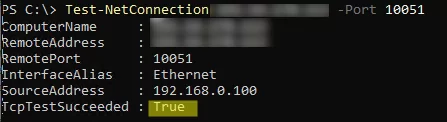
Check that your Zabbix server is available from the Windows host on port 10051:
Test-NetConnection 123.123.12.12 -Port 10051
How to Add a New Windows Host to Zabbix
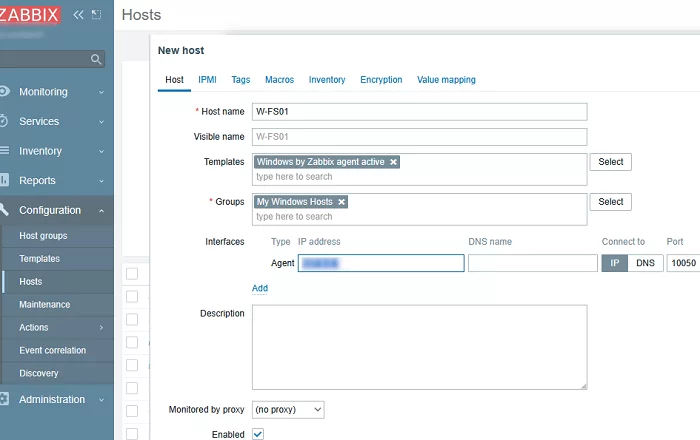
After installing the Zabbix agent on a Windows machine, you can add a new node via the Zabbix server web interface.
- Go to Configuration -> Hosts -> Create Host
- Set the host name (it must match the
hostnamespecified in the agent config). - Assign a template to the host (for starters, you can select the standard Windows template by Zabbix agent active) and the host group to which it should belong.
- Add the interface:
Add->Agent. Specify the DNS name or IP address of the agent for passive checks (if used).
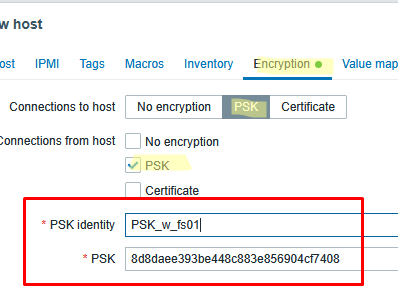
- Then, in the Encryption tab, enable encrypted connections using the PSK key. Copy and paste the name and value of the pre-shared key created on the client.
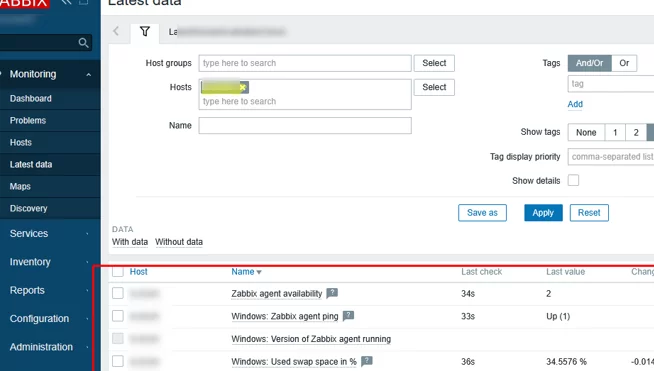
If everything is configured correctly, after a few minutes, you should see data received from the Windows host under the Monitoring -> Latest Data section.
Collecting Metrics from a Windows Host with Zabbix
Next, we’ll look at how to configure monitoring of only specific metrics on a Windows machine. Suppose you only want to monitor the availability of the Zabbix agent on the server, the percentage of used disk space, and the number of active network connections to the web server.
Built-in Zabbix templates can contain a large number of items. Zabbix adds dozens of additional elements to a host as a result of the Low Level Discovery (LLD) feature being enabled by default (separate items for each Windows service, several metrics for each physical drive, network interface, etc.). If you don’t need these data to be monitored, you can disable them either globally in the template or in the settings of a specific Zabbix node.
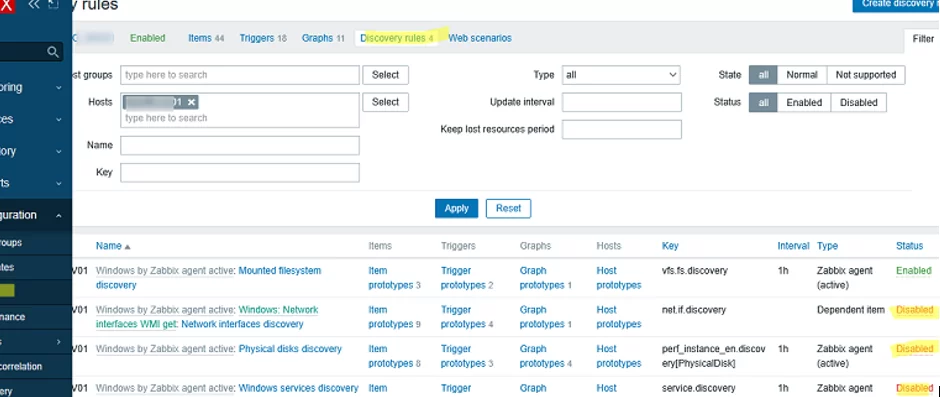
In this example, I will disable the autodiscovery rules for a specific host. Go to Hosts -> select your Windows host -> Items -> Discovery Rules tab. For example, I decided to disable the low-level discovery rules for services, network interfaces, and physical disks.
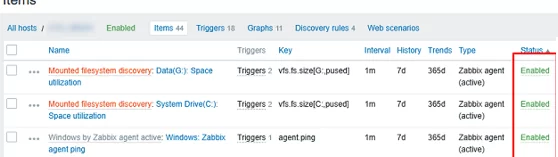
In the Items tab, you can temporarily disable or completely remove specific metrics for the host.
We will only collect the values of the following metrics from the host:
- Used disk space via built-in keys
vfs.fs.size[C:,pused]andvfs.fs.size[D:,pused] - Availability of the Zabbix agent via the
agent.pingkey
The next metric is the number of active HTTPS connections to the Windows web server, which we will obtain directly from the machine using PowerShell. To achieve this, a command or script is executed on the Windows host to collect the required data, after which the Zabbix agent sends the resulting value to the server as a monitored metric.
Edit the agent configuration file (zabbix_agent2.conf) on the Windows host and create a new metric that the agent will collect.
UserParameter=ActiveWebSessions,powershell -NoProfile -ExecutionPolicy bypass -Command "(Get-NetTCPConnection -LocalPort 443|measure).count"
-File parameter.Increase the Timeout value to 30 in the configuration file (the default setting is 3 seconds, which is sometimes not enough time for slow PowerShell commands or scripts).
Timeout=30

Restart the agent:
Restart-Service "Zabbix Agent 2"
Use the built-in zabbix_get.exe command-line tool to get the value of your custom metric from the Zabbix agent:
cd 'C:\Program Files\Zabbix Agent 2\'
.\zabbix_get.exe -s 127.0.0.1 -p 10050 --tls-connect=psk --tls-psk-identity="SRV01_PreShared_Key" --tls-psk-file="C:\Program Files\Zabbix Agent 2\psk.key" -k ActiveWebSessions

A new metric can now be added to a template for use on other hosts or to a specific Zabbix node.
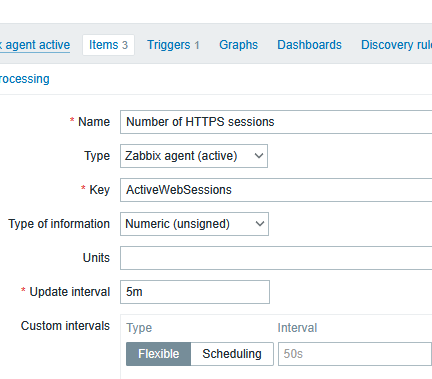
Go to the Items tab and add:
- Name:
Number of HTTPS sessions - Type:
Zabbix Agent (active) - Key:
ActiveWebSessions - Type of information:
Numeric (unsigned) - Update Interval:
5m - History:
90d - Trenfd:
365d
Check that the metric value from the PowerShell script appears in Monitoring -> Latest data on the Zabbix server.
Now, let’s create a trigger that will generate an alert when the number of active HTTPS sessions to the IIS web server on the host exceeds 1000 (this could be a sign of a potential DDoS attack on the Windows web server).
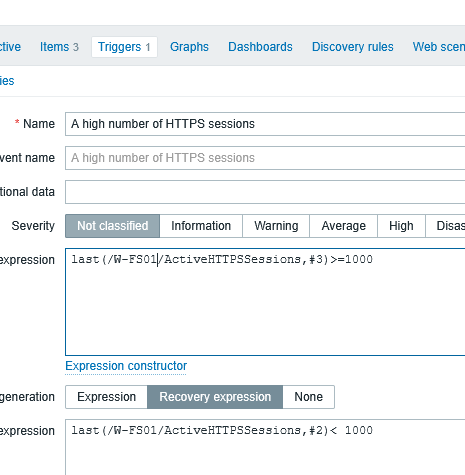
Go to the Trigger tab and add a new trigger.
- Name: A high number of HTTPS sessions
- Problem expression:
last(/W-FS01/ActiveHTTPSSessions,#3)>=1000– if the last three checks returned that the number of HTTPS sessions to a web server is more than 1000 - Recovery expression:
last(/W-FS01/ActiveHTTPSSessions,#2)< 1000– if the number of connections is lower than expected in the last two checks, we consider the metric to have returned to the normal state (recovered).
So, we have explained how to manually install and configure the Zabbix agent on a Windows machine, collect host data using built-in metrics, and disable unused ones. This article also covers how to get a custom metric from a PowerShell script on a Windows computer to the Zabbix agent, and how to transmit the collected values to the Zabbix server as monitored metrics.